
Figure 3.
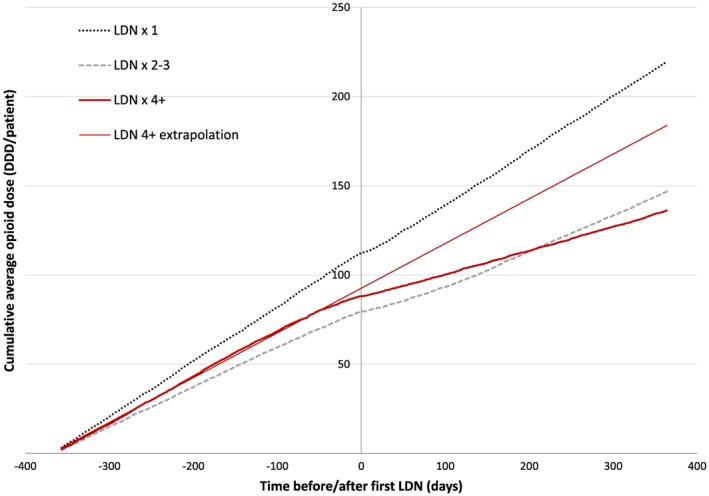
The effect of LDN on opioid consumption. Cumulative average opioid dose according to NorPD 1 year before and after the first LDN prescription in subgroups defined by number of LDN prescriptions collected. As a visual aid, an extrapolated linear regression line of opioid consumption 1 year before the first LDN prescription in the LDN ≥4 subgroup is added. [Colour figure can be viewed at wileyonlinelibrary.com]