
Figure 3.
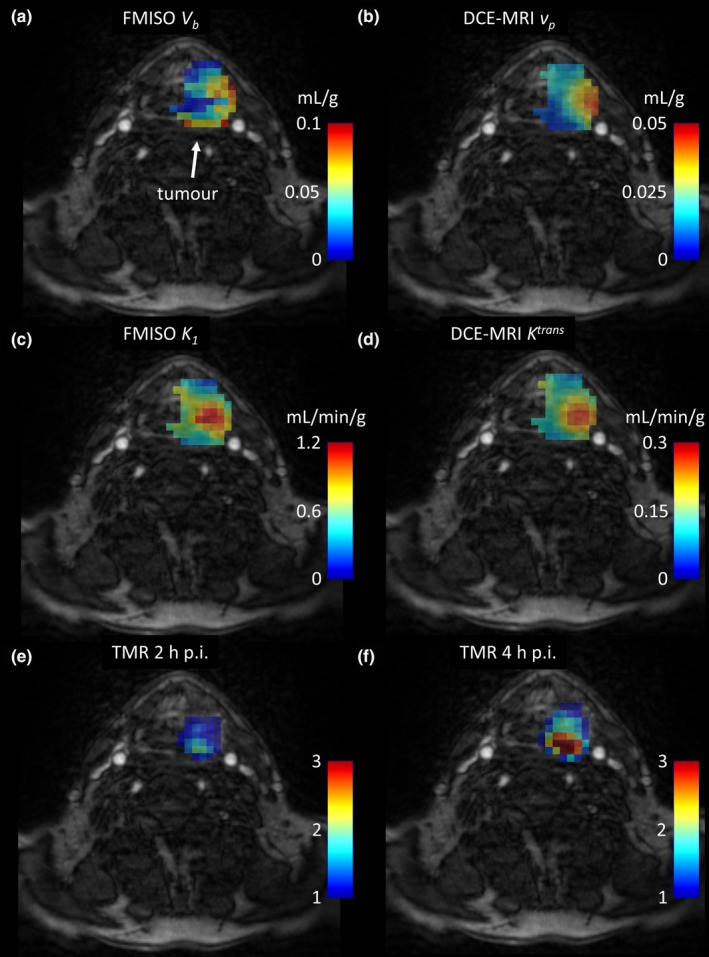
Contrast‐enhanced MRI images of the patient P4, overlaid with the FMISO V b and DCE‐MRI v p parametric images (a) and (b), FMISO K 1 and DCE‐MRI K trans parametric images (c) and (d), and TMR maps at 2 h and 4 h post injection (e) and (f). [Color figure can be viewed at wileyonlinelibrary.com]