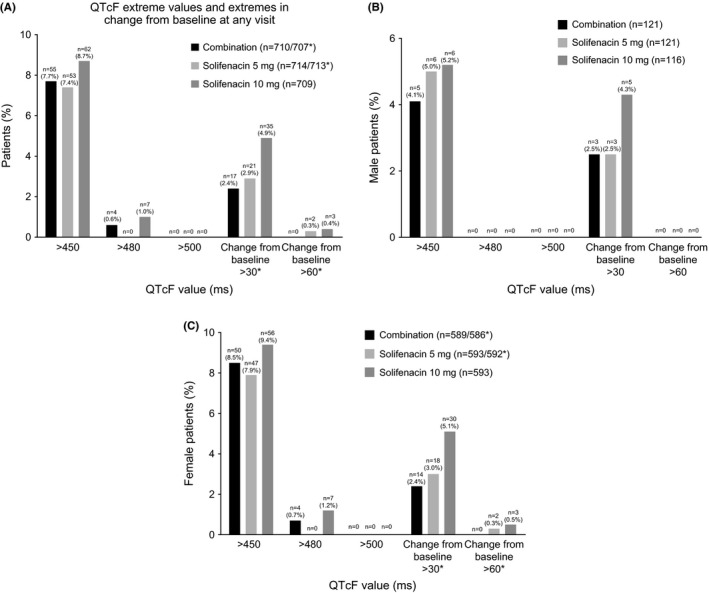
Figure 5.

Frequency of QT interval corrected using Fridericia's formula extreme values and extremes in change from baseline at any visit in the overall population (A), male (B) and female patients (C); results are based on the worst postbaseline mean value during the double‐blind treatment period
