
Figure 2.
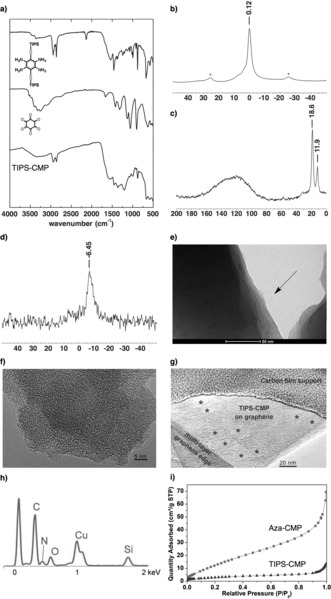
a) FTIR spectrum of TIPS‐CMP; b) solid‐state CP/MAS 1H NMR spectrum of TIPS‐CMP (* denotes side peaks); c) solid‐state CP/MAS 13C NMR spectrum of TIPS‐CMP; d) 29Si NMR spectrum of TIPS‐CMP; e) TEM image of TIPS‐CMP; f) HRTEM image of TIPS‐CMP; g) HRTEM image of an individual layer of TIPS‐CMP on graphene; h) EDX spectrum of TIPS‐CMP (Cu peak is due to the sample holder); i) N2 uptake of Aza‐CMP and TIPS‐CMP.