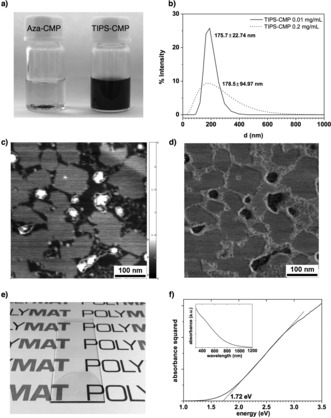
Figure 3.

a) Dispersions of Aza‐CMP and TIPS‐CMP in TFA; b) DLS of dispersions of TIPS‐CMP in TFA; c) height (range: 2.992 nm) and d) phase AFM images of a dispersion of TIPS‐CMP in H2O/EtOH (1:1); e) drop‐cast thin film of TIPS‐CMP from a dispersion in DMF/TFA (95:5); f) Tauc plot of the TIPS‐CMP thin film (inset shows the absorption trace of the thin film).
