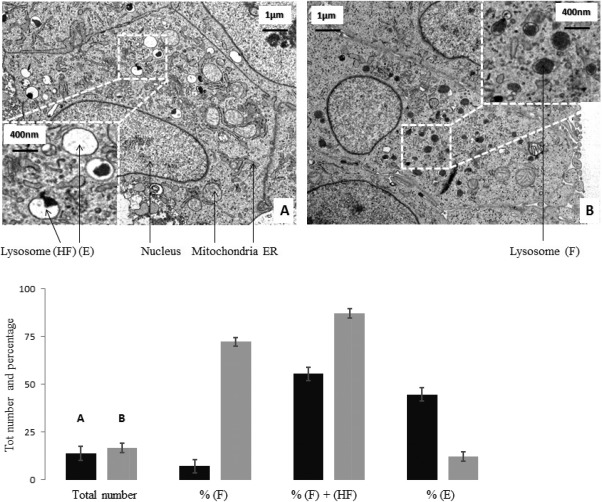
Figure 3.

Transmission Electron Microscope images of null (A) and GAA (B) cells.
Cells were sampled at the same time from actively growing cultures, fixed and ultra‐thin slices were prepared for TEM imaging (magnification 3000X). 33 images of single cells were taken per each sample. Lysosomes were counted and categorized based on content in Full (F), Half‐Full (HF) and Empty (E). Data were collated and analyzed in excel (black – null; gray – GAA). Images chosen are representative.
