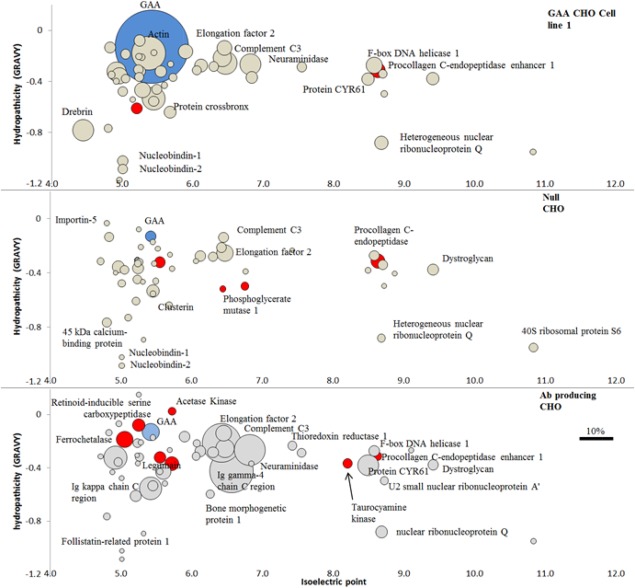
Figure 6.

High resolution LC‐MS/MS. In blue target molecule GAA, in red HCPs with proteolytic activity, in grey all other HCPs.
Data show identification and quantification of HCP found in capture step (IEX) eluate fraction across the three cell lines (GAA cell line1, null and mAb producing). Out of a total of 233 HCPs identified in the samples, 36 showed proteolytic activity. The first 50 more abundant species are reported per each cell line and ordered by calculated pI (ExPASy Compute pI/Mw tool, SIB Swiss Institute of Bioinformatics) on the X axis and by hydrophobicity index GRAVY (ExPASy ProtoParam tool, SIB Swiss Institute of Bioinformatics) on the Y axis. Bubble size represents percent of a given protein out of the total mass and was calculated by multiplying normalized abundance (averaged among triplicate LC injections) by the protein molecular weight. Post AIEX column eluate fractions were concentrated and digested with sequencing grade modified trypsin, 50 fmol of BSA standard was spiked in each digested sample before injection in LC to allow for label free quantitation. Separation via HSS T3 Acquity column (Waters) 75 μm internal diameter × 15 cm (1.8 μm, 100A) on‐line reverse phase UPLC (Acquity M‐Class, Waters). Elution via linear gradient from 3 to 40% B over 40 min; (buffer A: 0.1% formic acid in water. Buffer B: 0.1% formic acid in acetonitrile), flow rate 300 nl/min. Separated peptides were injected via nanospray source to a Synapt G2‐Si (Waters), data collected in HDMSe mode. Data analyzed using Progenesis QIP and searched against SwissProt using MSe Search and a false detection rate of 4%. Complete list of HCP identified in all samples is included in Supporting Information – “HCP full list.”
