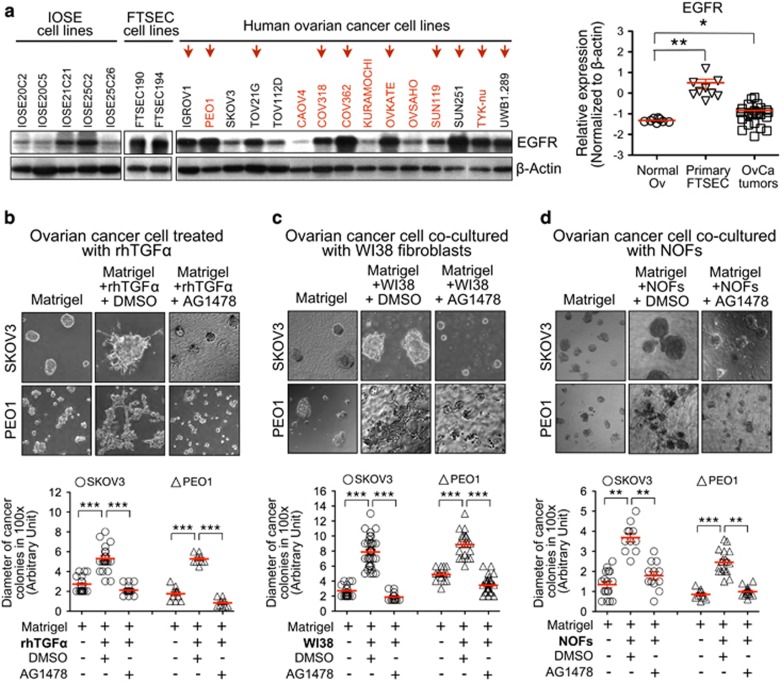
Figure 4.
TGF-α and fibroblasts promote colony formation of metastatic ovarian cancer cells in 3D organoid co-culture through activation of EGFR. (a) Protein expression of EGFR in IOSE, FTSEC, and human ovarian cancer cell lines was detected by Western blotting. β-actin was used for equal loading (left panel). mRNA expression of EGFR was compared between normal ovarian tissue (Normal Ov), micro-dissected fallopian tube secretory epithelial cells from primary normal fallopian tube (Primary FTSEC) and micro-dissected tumor tissue from primary ovarian cancers (OvCa tumors) by qRT-PCR (right panel). *P<0.05 and **P<0.01 (Mann-Whitney U test). The data represents means±s.e.m. from three independent experiments. (b–d) Phase-contrast images (100x magnification) of ovarian cancer colonies (SKOV3 or PEO1) were captured on day 8 in 3D organoid cultures, including 3D monoculture of ovarian cancer cells treated with rhTGF-α (b), 3D organoid co-culture with WI38 fibroblasts (c) and 3D organoid co-culture with primary normal omental fibroblasts (NOFs) (d) (upper panels). Treatments of AG1478 were also performed. DMSO was served as vehicle controls. Diameter of cancer colonies in 10 fields was measured (Arbitrary unit) in phase-contrast images, and their differences in treatment groups were compared with the DMSO control groups (lower panels). **P<0.01 and ***P<0.001 (Mann-Whitney U test). The data represents means±s.e.m. from two independent experiments, respectively.

