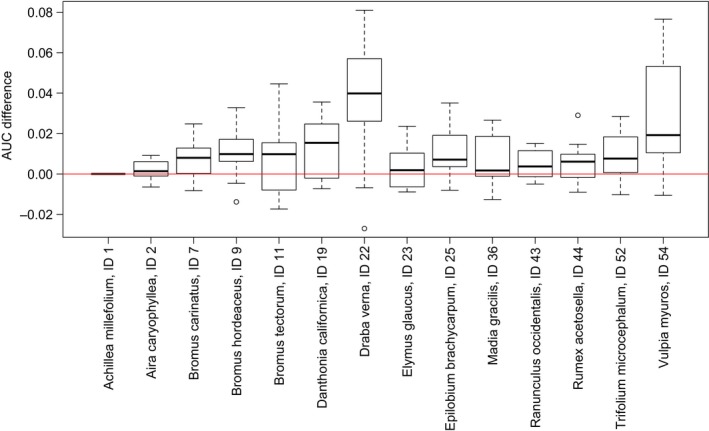
Figure 3.

Increases and decreases in AUC scores for the 14 focal species when including biotic interactions in species distribution models (SDMs). For each focal species, we calculated the difference in the AUC score when using posteriors (output of an SDM with biotic interactions) and when using priors (output of an SDM without biotic interactions) for the same partition of data into training and test sets. Paired differences in AUC were calculated for 20 random partitions for each focal species. Box plots show interquartile range, median, minimum and maximum values of paired differences in AUC. If the difference in AUC is consistently greater than zero, then the BN is valuable and including biotic interactions in SDMs improves estimates of species geographical ranges.
