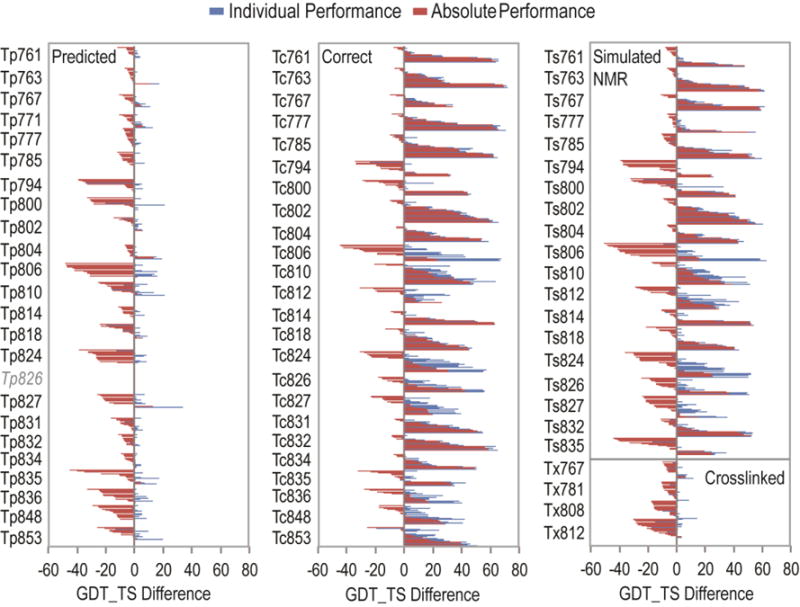
Figure 2. Absolute and Individual Performance for Assisted Targets.

Each group has one bar that corresponds to absolute performance (red), measured by subtracting the gold standard T0 model’s GDT_TS from the best T* model’s GDT_TS for the group; and one bar that corresponds to individual performance (blue), measured by subtracting the best T0 model GDT_TS for each group from their best T* model GDT_TS. The value of the GDT_TS performance difference is indicated below the bar graph, with a grey line drawn through 0. Overall performance on predicted Tp targets (left panel) and crosslinked Tx targets (lower right panel) was worse than on correct Tc targets (middle panel) and simulated NMR Ts targets (upper right panel).
