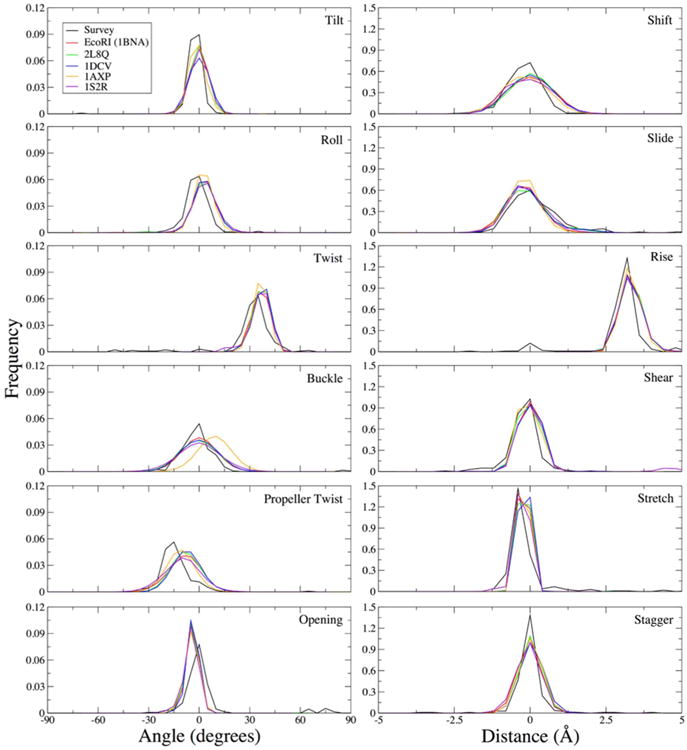
Figure 5.

Helicoidal parameter distributions from 1-μs simulations of five B-DNA structures compared to a crystal survey consisting of all B-DNA structures with resolution ≤ 2.5 Å, excluding any structures containing modified nucleotides, protein, RNA, or ligands. Each distribution from the MD simulations is based on snapshots at 10-ps intervals for a total of 100,000 samples per system. Histograms were constructed using a bin size of 5° for angles and 0.4 Å for distances.
