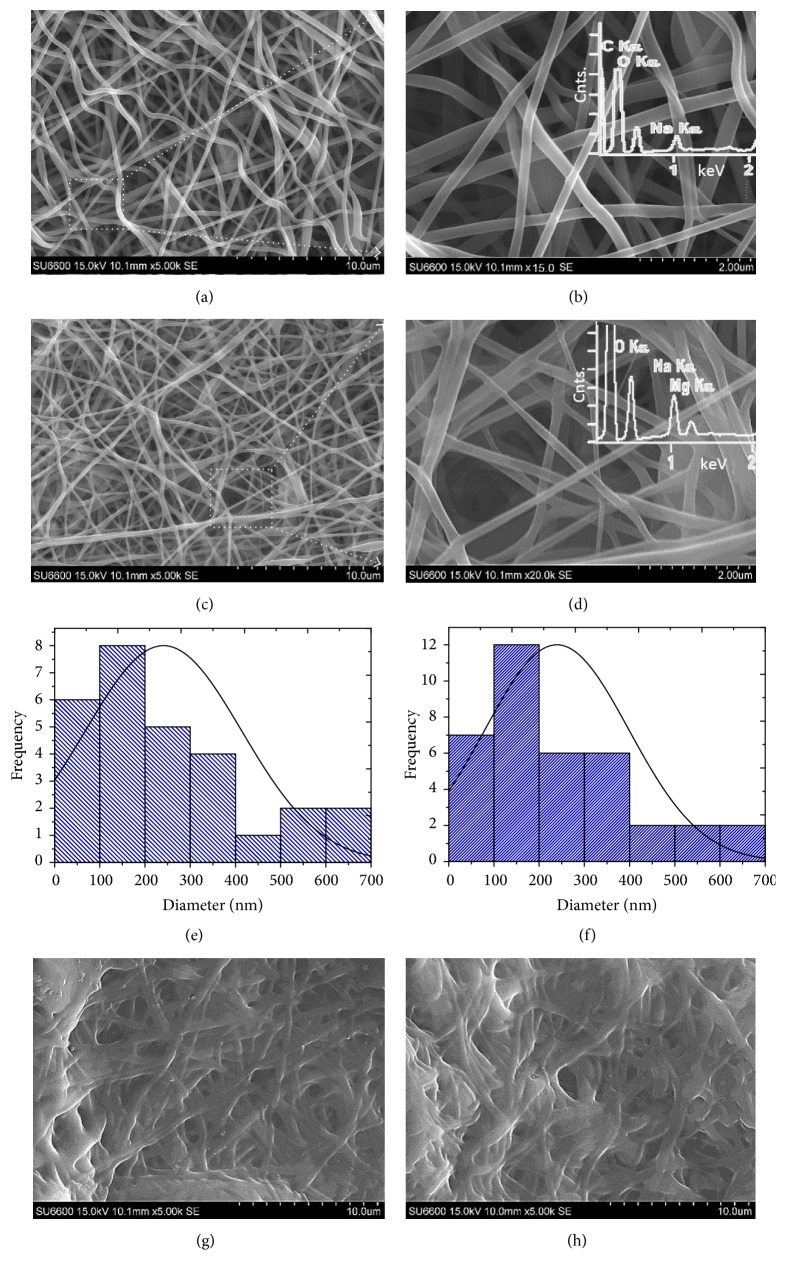
Figure 2.
Morphology of electrospun alginate-based scaffolds. (a, b) show SEM images of the alginate-based scaffolds. (c, d) show SEM images of the alginate/MgO scaffolds (with 10% (w/w) MgO). Histograms of frequency versus fibre diameter for the (e) alginate-based fibres and (f) alginate/MgO fibres. (g, h) show SEM images of the cross-linked alginate scaffolds. Insets in (b) and (d) are the graphs of the number of counts versus energy derived from EDX analysis.

