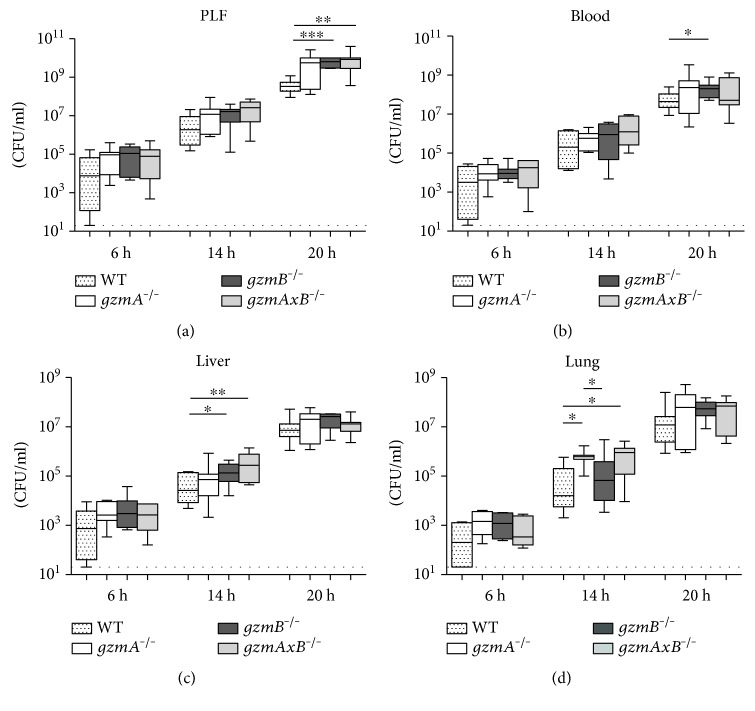
Figure 3.
Bacterial loads in peritoneal lavage fluid (PLF), blood, liver, and lung of wild-type, gzmA−/−, gzmB−/−, and gzmAxB−/− mice during E. coli peritonitis. Mice were infected intraperitoneally with 1.3∗104 CFU E. coli and sacrificed at 6, 14, and 20 h after infection. Data are box-and-whisker diagrams depicting the smallest observation, lower quartile, median, upper quartile, and largest observation. N = 7-8 per group at each time point. ∗P < 0.05, ∗∗P < 0.01, and ∗∗∗P < 0.001 by Mann–Whitney U test. Dotted line represents the lower detection limit of CFU.

