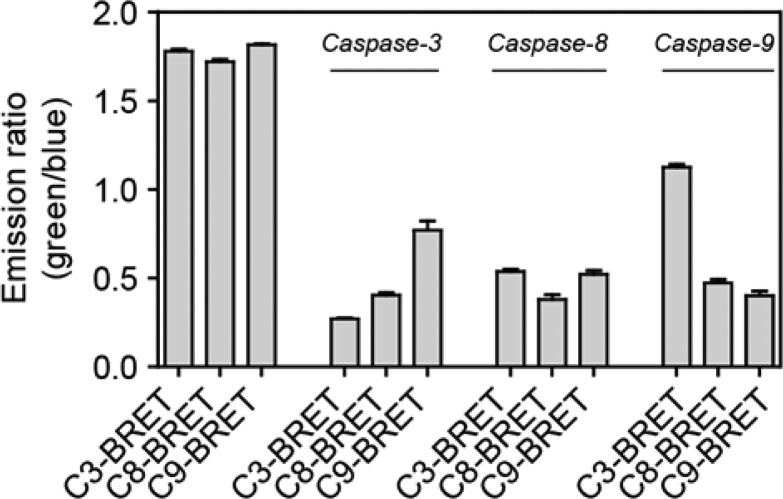
Figure 2.
Emission ratio of the caspase sensors C3-, C8-, C9-BRET (1 μM) after 5 min incubation in the absence of caspase (left 3 bars) and in the presence of caspase-3, -8, or -9 protein (1 μM). All measurements were conducted in buffer containing 20 mM Na2HPO4, 150 mM NaCl, 1 mM EDTA, 2 mM TCEP, 1 mg/mL bovine serum albumin, and 1 M sodium acetate to aid caspase dimerization, at pH = 7.1. Error bars represent the standard deviation (n = 3).

