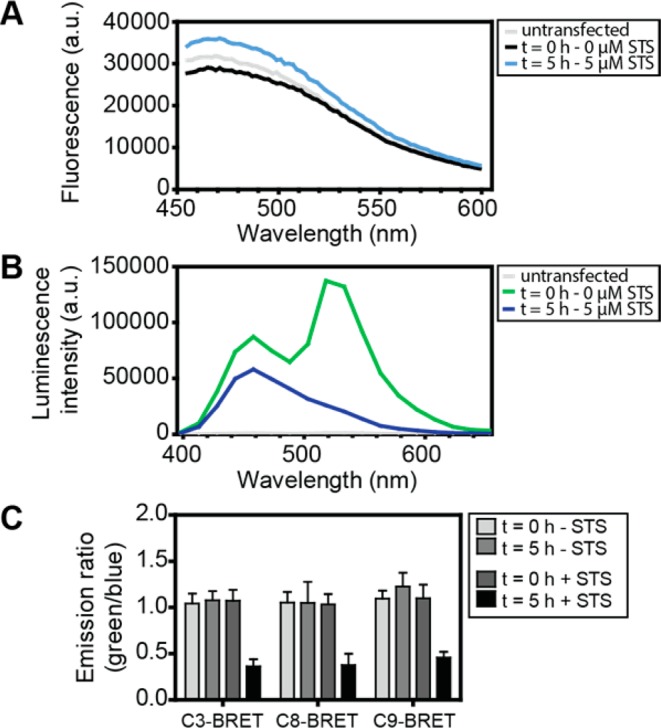
Figure 3.

Caspase activity measured in HeLa cells. (A) Emission spectra of nontransfected HeLa cells (light gray) and HeLa cells expressing the caspase-3 FRET sensor SCAT3 at 0 h (black) and 5 h (light blue) after addition of 5 μM STS, using an excitation wavelength of 410 nm. (B) Emission spectra of nontransfected HeLa cells (light gray) and HeLa cells expressing C3-BRET at 0 h (green) and 5 h (blue) after addition of 5 μM STS; emission spectra were measured using 40 filters covering the complete spectrum. (C) Absolute emission ratios of HeLa cells expressing C3-, C8-, and C9-BRET at t = 0 and t = 5 h, in the absence and presence of 5 μM STS. Blue emission was recorded between 445 and 470 nm and green emission between 505 and 530 nm. Error bars represent the standard deviation of 8 different wells.
