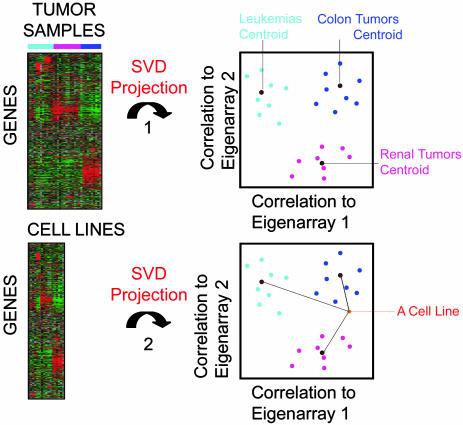
Fig. 2.
Illustrating the TSI methodology. SVD was performed on a prefiltered gene expression matrix of the tumor samples. Then, each tumor sample was projected into SVD space by measuring its correlation to the 16 Eigenarrays (EA) with largest singular values. We calculated each tumor type-specific centroid, respectively, as the geometric center of the tumor samples in SVD space. Thereafter, we identically projected each cell line into the SVD space. Finally, a TSI score was calculated measuring the correlation of each cell line in SVD space to each tumor type centroid.

