Figure 1.
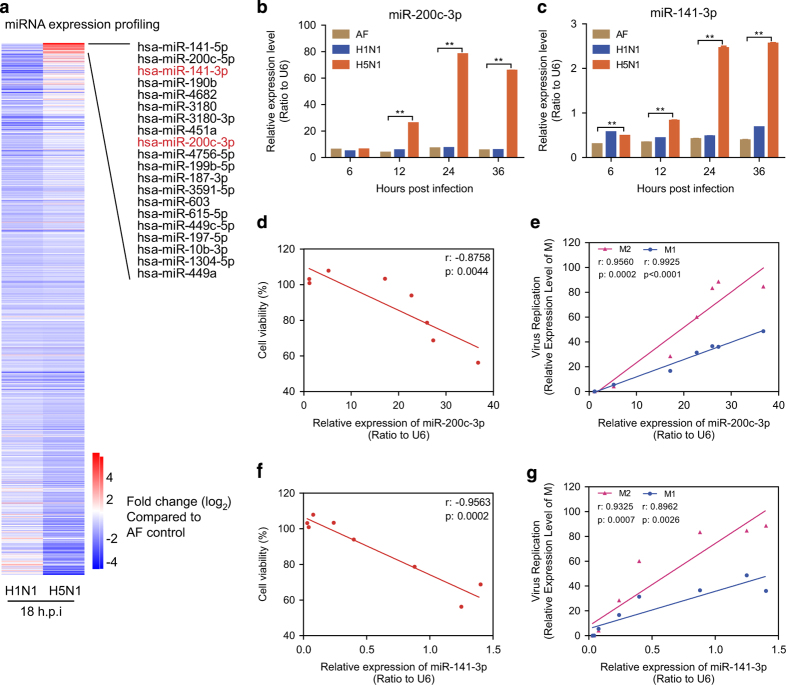
Aberrant expression of miR-200c-3p and miR-141-3p in H5N1-infected A549 cells. (a) Heat map of fold changes (log 2) of miRNAs’ expression in A549 cells after infection with either H1N1 or H5N1 (MOI=4) influenza virus for 18 h. The fold changes were compared with miRNAs’ expression in cells mock infected with AF for 18 h. The upregulated miRNAs in H5N1-infected A549 cells are listed. (b and c) qRT-PCR analysis of the expression of miR-200c-3p and miR-141-3p in A549 cells at the indicated hours after challenge with H1N1 virus, H5N1 virus (MOI=4) or AF control. Graph shows the mean±s.e.m. **P<0.01. (d and e) Correlation between the expression of miR-200c-3p and cell viability or virus replication in H5N1-infected A549 cells. Pearson's correlation analysis was used to analyze the correlation. Pearson's correlation coefficients (r) and P-values are provided in each graph. Viral replication was indicated with the relative expression levels of M1 and M2. (f and g) Correlation between the expression of miR-141-3p and cell viability or virus replication in H5N1-infected A549 cells. Pearson's correlation analysis was used to analyze the correlation. Pearson's correlation coefficients (r) and P-values are provided in each graph.

