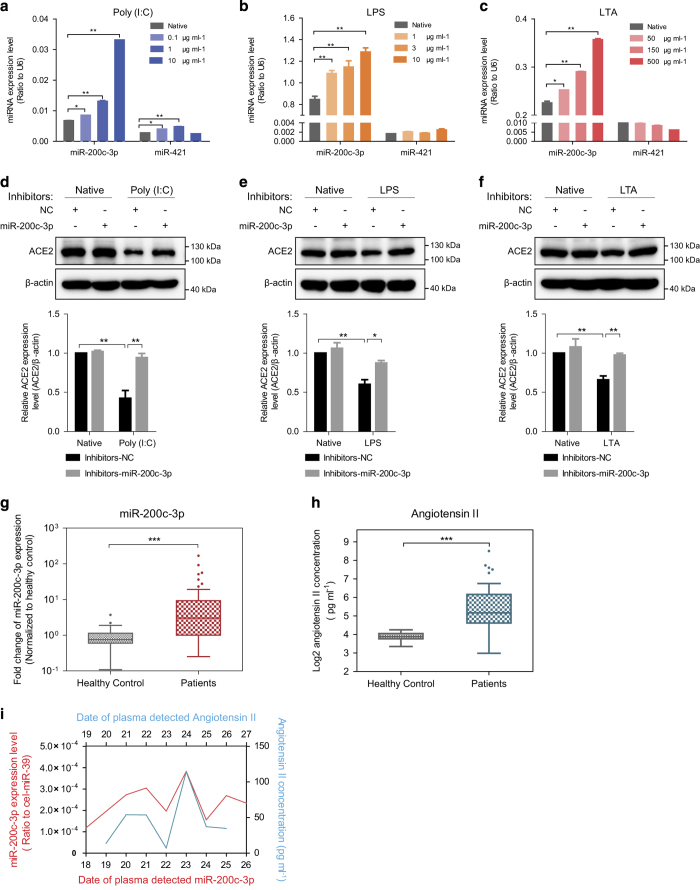
Figure 3.
Elevated levels of miR-200c-3p in cells treated with poly (I:C), LPS and LTA and in the plasma of severe pneumonia patients. (a) qRT-PCR analysis of the expression of miR-200c-3p and miR-421 in A549 cells transfected with poly (I:C) for 6 h at the indicated concentration. (b) qRT-PCR analysis of the expression of miR-200c-3p and miR-421 in A549 cells treated with LPS for 24 h at the indicated concentration. (c) qRT-PCR analysis of the expression of miR-200c-3p and miR-421 in A549 cells treated with LTA for 24 h at the indicated concentration. (d) After transfection with inhibitors of NC or miR-200c-3p for 6 h, A549 cells were transfected with poly (I:C) (10 μg ml−1). The expression of ACE2 protein in the cells was detected. Native, A549 cells were treated with the solvent used. (e) After transfection with inhibitors of NC or miR-200c-3p for 6 h, A549 cells were challenged with LPS (10 μg ml−1). The expression of ACE2 protein in the cells was detected. Native, A549 cells were treated with the solvent used. (f) After transfected with inhibitors of NC or miR-200c-3p for 6 h, A549 cells were challenged with LTA at (500 μg ml−1). The expression of ACE2 protein in the cells was detected. β-Actin served as an internal control. Native, A549 cells were treated with the solvent used. (g and h) qRT-PCR analysis of miR-200c-3p (g) and enzyme-linked immunosorbent assay analysis of Ang II (h) in the plasma of healthy controls and severe pneumonia patients. The number of the study participants for each group was as follows: healthy control group (n=21), severe pneumonia patients (n=56). (i) Kinetics of miR-200c-3p (ratio to cel-miR-39 which was used as a spike-in control) and Ang II plasma levels of one severe pneumonia patient (patient 48th). The data are shown as the mean±s.e.m. **P<0.01 and ***P<0.001.

