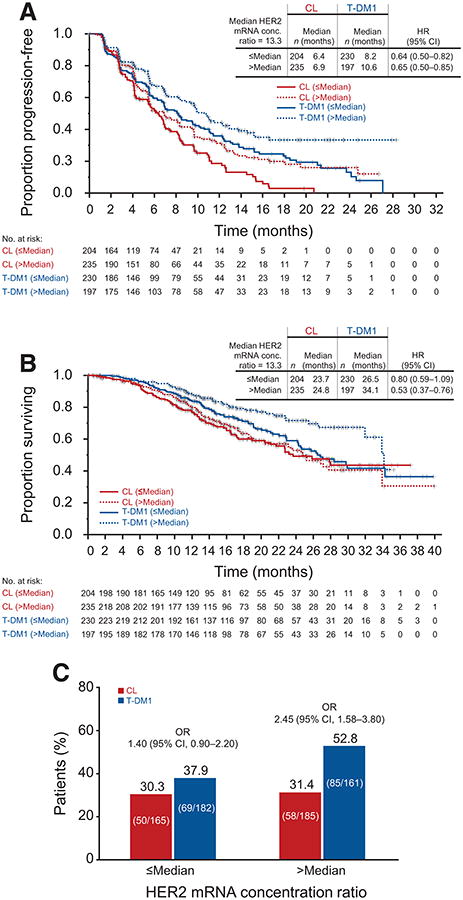
Figure 1.

Kaplan–Meier estimates of PFS (A), OS (B), and ORR (C), by independent review committee, according to HER2 mRNA expression in EMILIA. HRs are based on unstratified analyses. Results for the CL arm are based on 439 patients who were evaluable for HER2 mRNA expression (88.5% of 496 patients randomized to CL). Results for the T-DM1 arm are based on 427 evaluable patients (86.3% of 495 patients randomized to T-DM1). OR, odds ratio.
