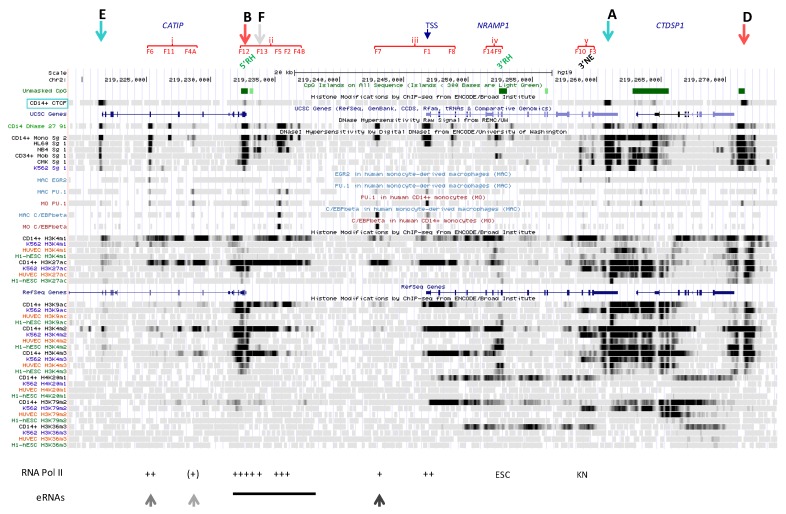
Figure 7.
Epigenetic modifications and myeloid transcriptional regulatory elements at NRAMP1 locus (data from ENCODE consortium [9,10,78] or stated otherwise). From top to bottom: Gene names, location of CTCF sites delineating NRAMP1 locus (light blue arrows, A and E) and CTDSP1 gene (red arrow, D) and position of NRAMP1 TSS (blue arrow); chromosome segments comprising transcriptionally active regions; position of DHSs (F1-F14), RHs and negative element (NE); chromosome 2 scale; CpG islands; CTCF sites in CD14+ MNs; UCSC gene descriptions; DNAse1 footprints in CD14+ MNs, HL-60, NB4, mCD34, CMK and K562 cells; EGR2, PU.1 and C/EBPb ChIP-seq data from MO and MAC [13]; H3K4me1 and H3K27ac ChIP-seq data from CD14+ MNs, K562 cells, HUVEC and ESC; RefSeq genes; H3K9ac, H3K4me2, H3K4me3, H4K20me1, H3K79me2 and H3K36me3 ChIP-seq data from CD14+ MNs, K562 cells, HUVEC and ESC; areas bound by RNA Pol II in HL-60 cells, except ESC (Embryonic stem cells) and KN (K562 and NB4 cells); eRNAs: major CAGE signals in CD14+ MNs [68]. Details on the transcriptionally active regions i–v are presented in Figure 2, Figure 3, Figure 4, Figure 5 and Figure 6 and Figures S3–S7 and S14.

