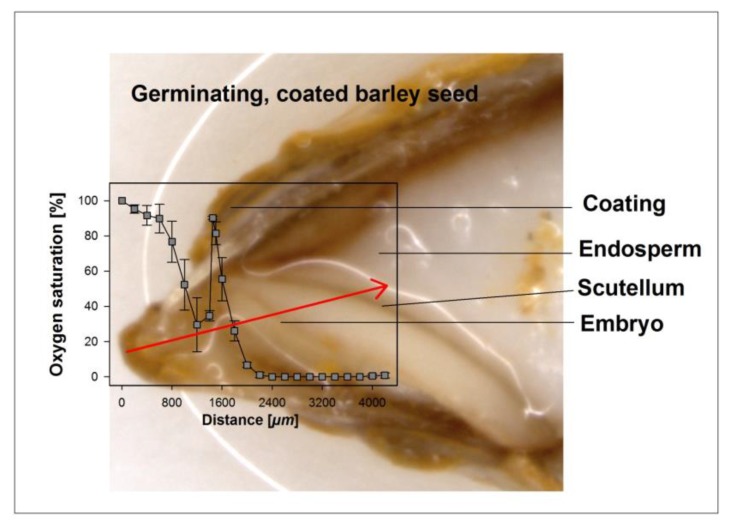
Figure 1.
Exemplary illustration of an oxygen profile through the coating, the seed coat, and the embryo into the endosperm. The oxygen profile shown was taken along the path of the micro-probe, as indicated by the arrow on the image. Distances shown in the graph do not fully match dimensions in the image due to a slight skew in the longitudinal cut.

