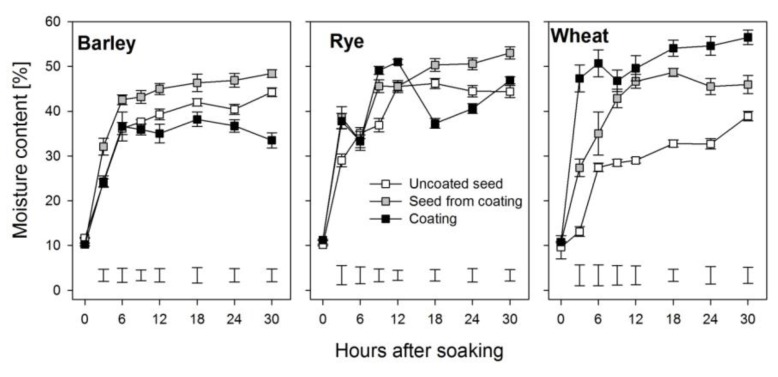
Figure 2.
Moisture content of seeds within the coat, the uncoated seeds, and the coating during the first 30 h after soaking in barley, rye, and wheat. Error bars represent standard error of means and bars at the bottom of the graphs represent the least significant difference between treatments at each point in time.

