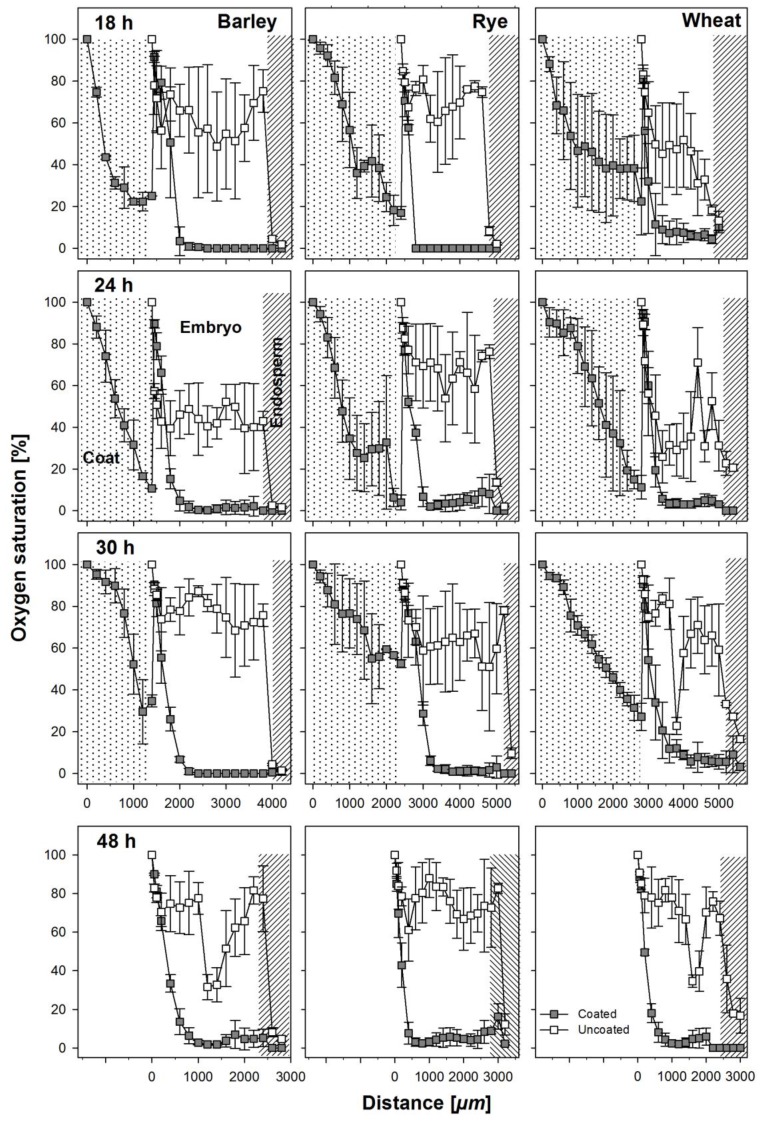
Figure 3.
Oxygen profiles taken as indicated in Figure 1 at 18, 24, 30, and 48 h after soaking from coated and uncoated seeds of barley, rye, and wheat. The apparent increase of oxygen concentration after the coating material in the profiles from the coated seeds is an artifact due to the necessity to remove the coat before entering the micro-probe into the embryo. Coats where not present anymore at 48h after soaking and the radicula was visible. Error bars represent standard error of means.

