
Fig. 5.
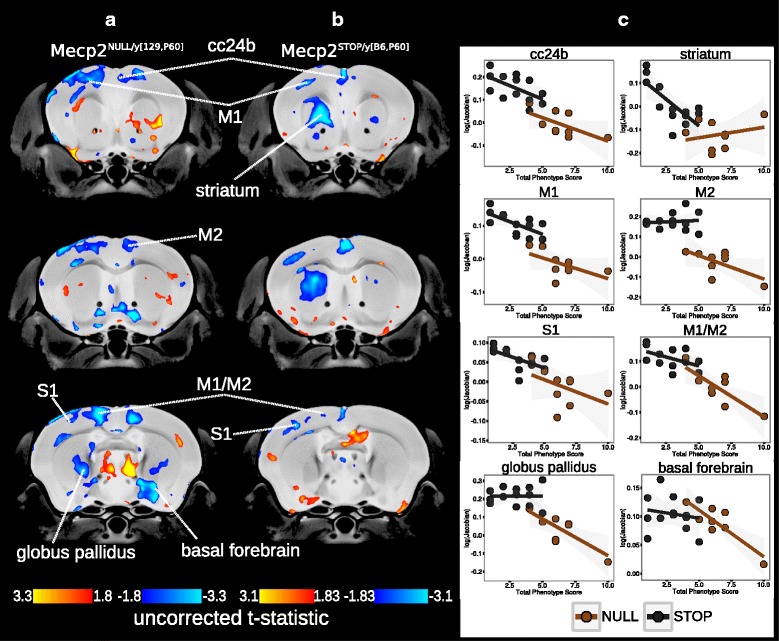
Neuroanatomical correlations with phenotype. Correlations between volume and total phenotype score within the hemizygous a Mecp2NULL/y[129,P60]; uncorrectedt = 1.8 and b Mecp2STOP/y[B6,P60]; uncorrected = 1.83 brains (uncorrected threshold ranging from p < 0.05 to p < 0.005). The volume of voxels either negatively or positively correlated with total phenotype score (blueand redregions, respectively). c Plots of the correlation between phenotype score and the normalized Jacobian determinant. Mecp2STOP/y[B6,P60]) (black circles and line), Mecp2NULL/y[129,P60] (brown circles and line). cc24b Cingulate cortex area 24b, M1 primary motor cortex, M2 secondary motor cortex, striatum, S1 primary somatosensory cortex, globus pallidus, basal forebrain