Fig. 4.

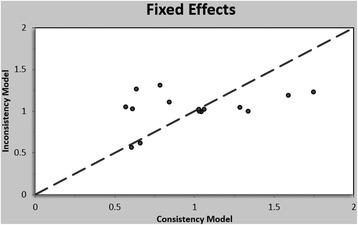
Inconsistency plot of enrolled studies. Plot of the posterior mean deviance of each study for the consistency model (horizontal axis), and the unrelated mean-effects model (vertical axis), along with the line of equality

Inconsistency plot of enrolled studies. Plot of the posterior mean deviance of each study for the consistency model (horizontal axis), and the unrelated mean-effects model (vertical axis), along with the line of equality