Fig. 5.

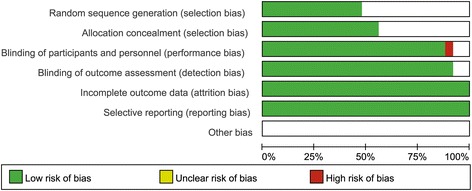
Summary of risk of bias. This figure summarizes the risk of bias for each study as a risk of bias summary of the overall meta-analysis. Green represents low risk of bias and red represents high risk of bias

Summary of risk of bias. This figure summarizes the risk of bias for each study as a risk of bias summary of the overall meta-analysis. Green represents low risk of bias and red represents high risk of bias