Fig. 2.

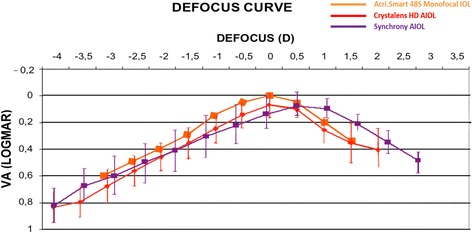
Median defocus curve by group. The error bars represent the range associated with each median value (VA: visual acuity; IOL: intraocular lens; AIOL: accommodative intraocular lens). Reprinted with permission from[20]

Median defocus curve by group. The error bars represent the range associated with each median value (VA: visual acuity; IOL: intraocular lens; AIOL: accommodative intraocular lens). Reprinted with permission from[20]