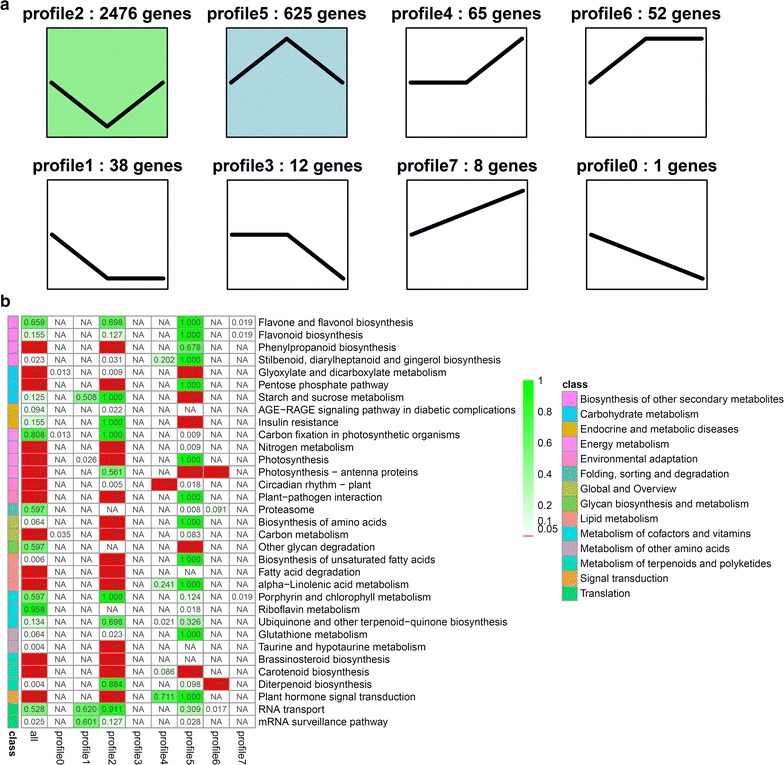
Fig. 3.

Dynamic transcriptome of L. aequinoctialis during nitrogen starvation. a Cluster of gene expression patterns in response to nitrogen starvation. Short time-series expression miner (STEM) was used to analyze the gene expression pattern, and eight profiles exhibited significant clustering of gene expression patterns. The number of unigenes in each profile was labeled above the frame. The black line represents the general tendency in each profile. Expression patterns of 8 profiles at different stages under nitrogen starvation. b Enrichment of functional categories of each cluster with the significantly enriched KEGG pathways plotted for DEGs among the three stages of nitrogen starvation
