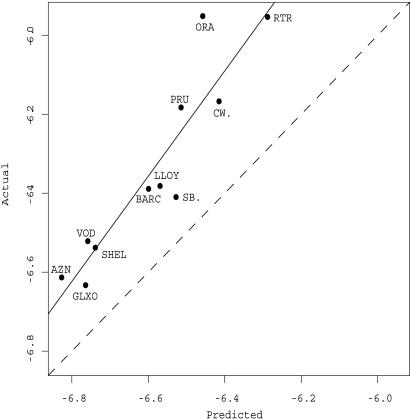
Fig. 3.
Regressions of predicted values based on order flow using Eq. 2 vs. actual values for the logarithm of the price diffusion rate. The dots show the average predicted and actual values for each stock averaged over the full 21-mo time period. The solid line is a regression; the dashed line is the diagonal, with A = 1 and B = 0.

