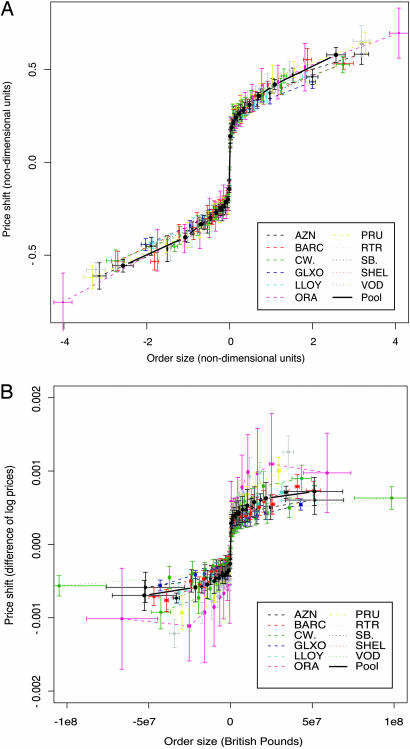
Fig. 4.
The average market impact as a function of the mean order size. In A, the price differences and order sizes for each transaction are normalized by the nondimensional coordinates dictated by the model, computed on a daily basis. Most of the stocks collapse onto a single curve; there are a few that deviate, but the deviations are sufficiently small that, given the long-memory nature of the data and the crosscorrelations among stocks, it is difficult to determine whether these deviations are statistically significant. This means that we understand the behavior of the market impact as it varies from stock to stock by a simple transformation of coordinates. In B, for comparison, we plot the order size in units of British pounds against the average logarithmic price shift.

