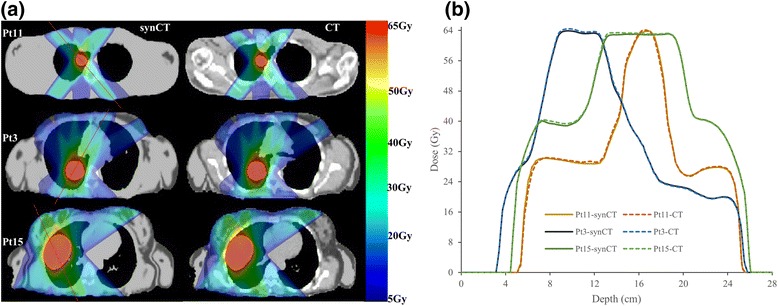
Fig. 1.

(a): MR synthetic CTs (left) and standard planCTs (right) overlapped with planned doses for a small tumor of Pt11 (top row), medium-sized tumor of Pt3 (middle row) and large-sized tumor of Pt15 (bottom row). PTVs were contoured; a red line across the tumor was drawn for dose line analysis. (b): doses along the drawn lines for the three patients
