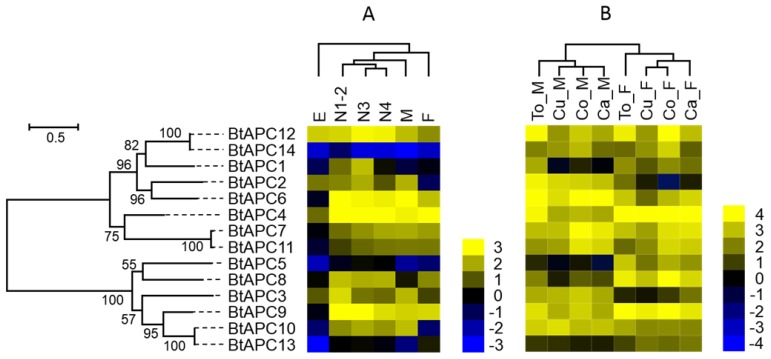
Figure 4.
Gene expression of APC transporters as affected by B. tabaci B stage (A) and host plant (B). The phylogenetic tree on the left reflects the phylogenetic relationships of APC transporters in B. tabaci B. The genes correspond to those in Figure 1. A total of 14 amino acid sequences were used for phylogenetic analyses. The phylogenetic analysis was conducted in MEGA6. Bootstrap values were shown at branch points. Values are based on log2-transformed FPKM values relative to the median intensity of all contigs (yellow represents higher expression values; blue represents lower expression values). E, Egg; N1-2, 1st- and 2nd-instar nymphs; N3, 3rd-instar nymph; N4, 4th-instar nymph; M, Male; F, Female; Ca_F, Female B. tabaci B on cabbage; Ca_M, Male B. tabaci B on cabbage; Cu_F, Female B. tabaci B on cucumber; Cu_M, Male B. tabaci B on cucumber; Co_F, Female B. tabaci B on cotton; Co_M, Male B. tabaci B on cotton. To_F, Female B. tabaci B on tomato; To_M, Male B. tabaci B on tomato.

