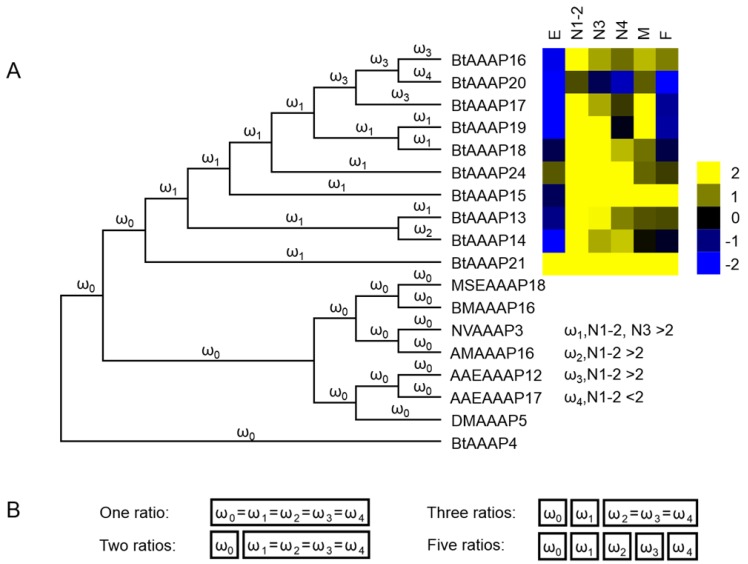
Figure 7.
Molecular evolution models of B. tabaci B -specific AAAP expansion. Phylogenetic analysis for B. tabaci B -specific AAAP family expansion is shown in (A), and each branch of the phylogeny tree is assigned a ω category as indicated. The expression profiles of BtAAAP genes in different stages of B. tabaci B were obtained using RNA-seq; values are based on log2-transformed FPKM values relative to the median intensity of all contigs (yellow represents higher expression values; blue represents lower expression values. E, Egg; N1-2, 1st- and 2nd-instar nymphs; N3, 3rd-instar nymph; N4, 4th-instar nymph; M, Male; F, Female. The models tested are shown in (B). The model names indicate the number of ω categories assumed (e.g., one ratio assumes equal ω across all branches, while two ratios assume two ω across all branches).

