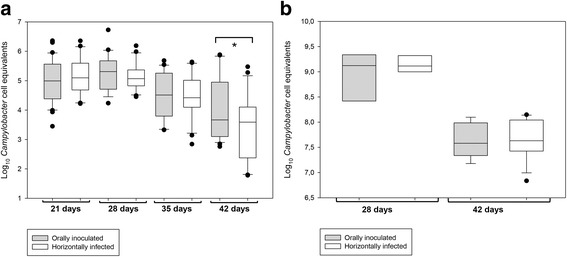
Fig. 3.

Campylobacter load in experimentally inoculated (grey) vs. non-inoculated (white) broilers as determined by real-time PCR analysis of cloacal swabs at days 21, 28, 35 and 42 (a) and broilers’ caeca at days 28 and 42 (b), representing shedding and colonization levels, respectively. Real-time PCR Ct values were transformed into Log10 Campylobacter cell equivalents per cloacal swab (a) or per g of caecal content (b). The boundary of the box closest to zero indicates the 25th percentile, the continuous line within the box marks the median, a dashed line marks the mean and the boundary of the box farthest from zero indicates the 75th percentile. Error bars above and below the box indicate the 90th and 10th percentiles. Outlying points (5th and 95th percentiles) are represented as closed dots. Significant differences between orally inoculated and horizontally infected are marked with an asterisk
