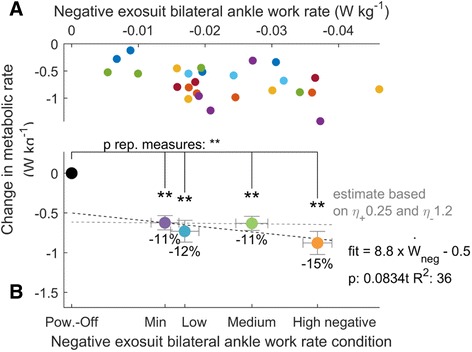
Fig. 3.

Change in metabolic rate versus negative exosuit bilateral ankle work rate. a Individual data. Colors are different participants. b Average for each condition. Error bars are s.e.m. Percentages are percent metabolic reduction. Dashed black line indicates linear fit from mixed-model ANOVA. Dashed grey line indicates expected trend assuming exosuit positive and negative work efficiencies corresponding to the reported efficiency of biological muscles [23]. Brackets indicate pairwise differences versus Powered-Off. Black dot represents Powered-Off. ** is p ≤ 0.01, * is p ≤ 0.05
