
Fig. 4.
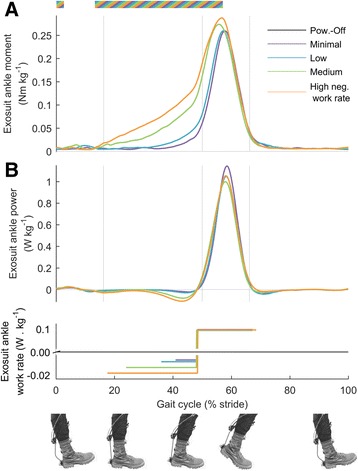
Ankle actuation. a Exosuit ankle moment. b Exosuit ankle power. Colored lines represent average time series in the four active conditions. Lower panel shows duration and rate of negative and positive work assistance per leg in conditions with corresponding colors. Grey vertical lines delimit double and single stance phases. Multi-colored bars indicate significant result of mixed-model ANOVA with the rate of negative work assistance as fixed-effect (p ≤ 0.05). Related metric plots can be found in Additional file 6