
Fig. 6.
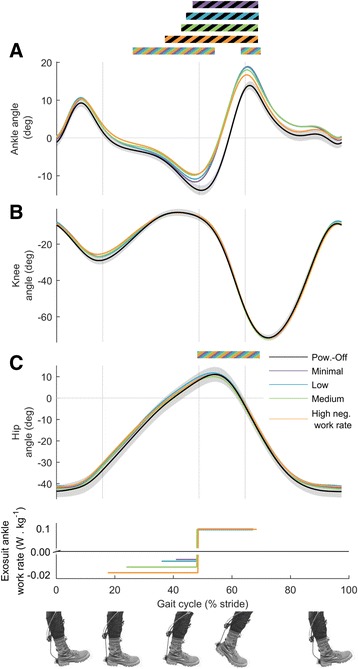
Joint kinematics. a Ankle angle. b Knee angle. c Hip Angle. Colored lines represent average time series from left and right leg in conditions with different rates of negative work assistance. Lower panel shows duration and rate of negative and positive work assistance per leg in conditions with corresponding colors. Black line is Powered-Off and shaded areas represent standard error. Grey vertical lines delimit double and single stance phases. Bi-colored bars (black and other color) above time series, indicate periods with significant pairwise difference versus Powered-Off of the condition with the corresponding color (p ≤ 0.05). Multi-colored bars indicate significant result of mixed-model ANOVA with the rate of negative work assistance as fixed-effect (p ≤ 0.05). Related metric plots can be found in Additional file 8