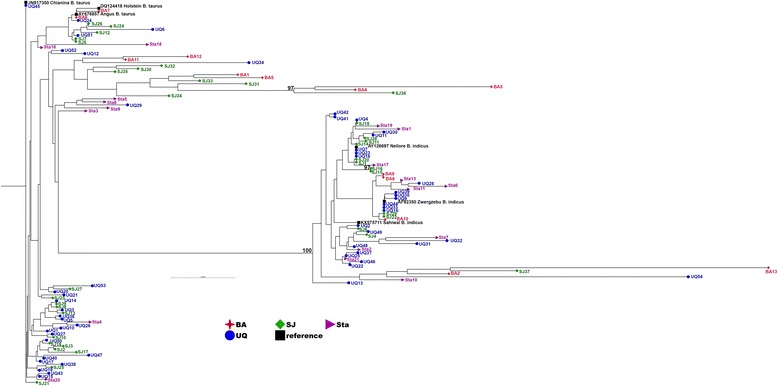
Fig. 2.

Phylogenetic tree of the D-loop regions of cattle samples from the Northern Territory, Australia. The maximum likelihood phylogenetic tree was constructed by the General Time Reversible model with 1000 bootstrap replicates using the CLC Genomics Workbench version 9.5.1. Samples were obtained from NT research and commercial breeding stations (121 samples). Each animal ID, starting with UQ, SJ, BA, Sta, refers to phenotypes listed in Table S1. UQ, SJ, BA, Sta and the reference mtDNA sequences are represented in blue, green, red, purple and black, respectively. Numbers above branches are bootstrap values >95%
