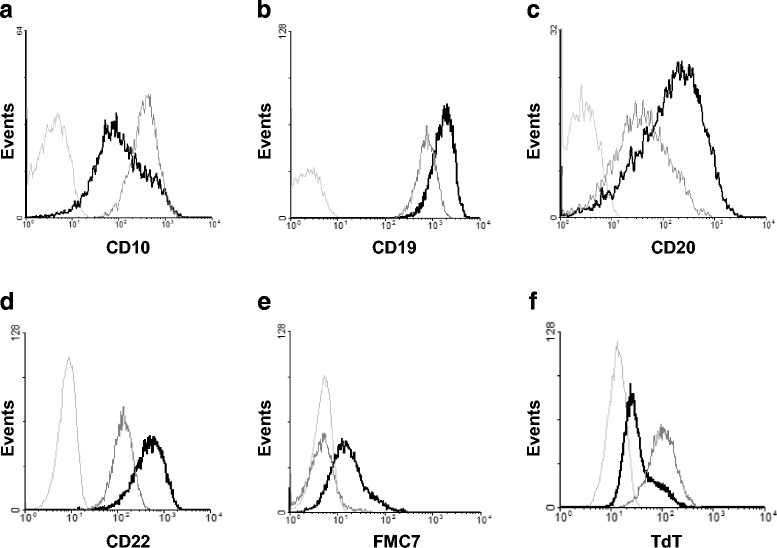
Fig. 5.

Flow cytometric analysis of phenotypic changes induced by PMA treatment. Kasumi-2 cells were treated with 10−8 M PMA for 4 days (black curves) and the expression of various early B lymphoid phenotypic markers was compared to untreated cells (grey curves). Appropriate isotype-matched irrelevant antibodies were used as negative control (light grey curves). Treatment led to increased expression of the CD19, CD20, CD22 and FMC7 differentiation markers (b, c, d and e, respectively), whereas the expression of the CD10 (a) and of intracellular TdT (f) decreased
