
Fig. 2.
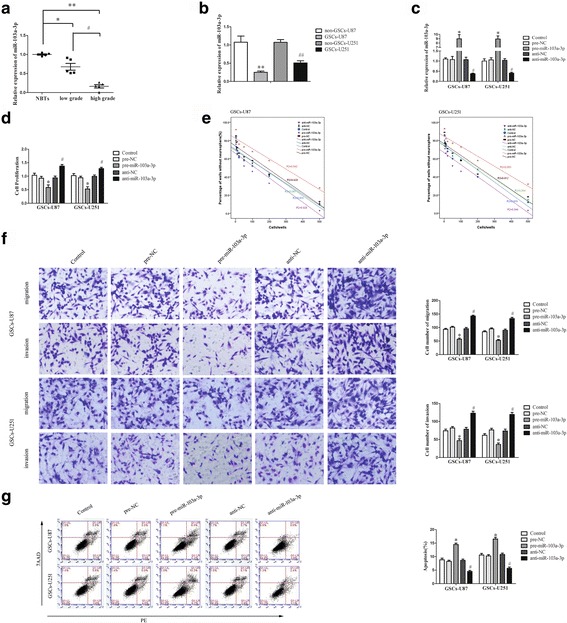
miR-103a-3p manifested an anti-oncogene in GSCs. a Expression of miR-103a-3p in glioma tissues of different grades and NBTs (Data are presented as the mean ± SD (n = 10, each group). **P < 0.01 vs. NBTs group; *P < 0.05 vs. NBTs group; # P < 0.05 vs. low grade group. b Expression of miR-103a-3p in non-GSCs and GSCs (Data are presented as the mean ± SD (n = 5, each group). **P < 0.01 vs. non-GSCs-U87 group; ## P < 0.01 vs. non-GSCs-U251 group. c Relative expression of miR-103a-3p after GSCs transfected with pre-miR-103a-3p, anti-miR-103a-3p as well as their scrambled vectors (NC). d Effect of miR-103a-3p on the proliferation of GSCs. e Effect of miR-103a-3p on the sphere-formation ability of GSCs. f Effect of miR-103a-3p on the migration and invasion of GSCs. g The apoptotic rates after GSCs transfected with pre-miR-103a-3p and anti-miR-103a-3p. *P < 0.05 vs. pre-NC group; # P < 0.05 vs. anti-NC group. Scale bars, 20 μm. The photographs were taken at 200 × magnification