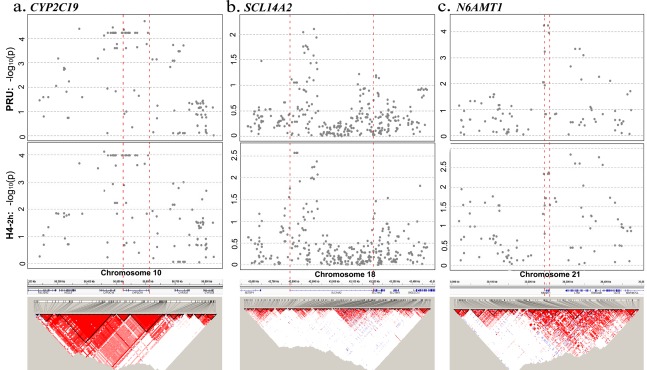
Figure 2.

Linkage disequilibrium block analysis of single‐nucleotide polymorphisms in a 250 kb region upstream and downstream of CYP2C19 rs4244285 (*2) on chromosome 10 (a), SCL14A2 rs12456693 on chromosome 18 (b), N6AMT1 rs2254638 on chromosome 21 (c), and their relationship with P2Y12 reaction unit (PRU) and H4 concentration at 2 h in 115 patients with coronary heart disease. [Color figure can be viewed at wileyonlinelibrary.com]
