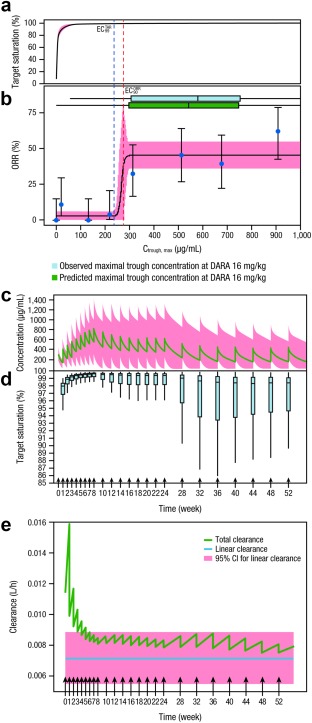
Figure 1.

Exposure‐response relationship between daratumumab concentration and target saturation (a), and between ORR and predicted Ctrough,max (b). Representative PK profile of daratumumab (c), including boxplots for the target saturation profile of daratumumab at pre‐infusion time points for the patient population at the recommended dose and schedule (d). Total and linear clearance vs. time for the daratumumab 16‐mg/kg dose regimen (e). In Panel a, the centered curves and shaded areas represent predicted target saturation and 95% CI, respectively. In Panel b, the solid blue dots represent the proportion of responders grouped by eight quantiles of Ctrough,max and plotted at the geometric mean for each group. The bars represent the 95% CI for the proportion in each group. The centered curves and shaded areas represent predicted ORR values and 95% CIs of model‐predicted response rate, respectively. The horizontal boxplots represent the predicted (blue) and observed (green) maximal trough concentration at daratumumab 16 mg/kg. In Panel c, the green line indicates simulated population mean values and the pink shaded area indicates the 95% prediction intervals. In Panels c–e, arrows indicate the daratumumab 16‐mg/kg dose regimen: QW for 8 weeks, Q2W for 16 weeks, and then Q4W thereafter. ORR, overall response rate; Ctrough,max, maximal trough concentration; PK, pharmacokinetic; CI, confidence interval; QW, once weekly; Q2W, every 2 weeks; Q4W, every 4 weeks; , concentration estimated to provide 99% target saturation; , concentration estimated to provide 90% maximal effect on ORR; DARA, daratumumab; CI, confidence interval.
