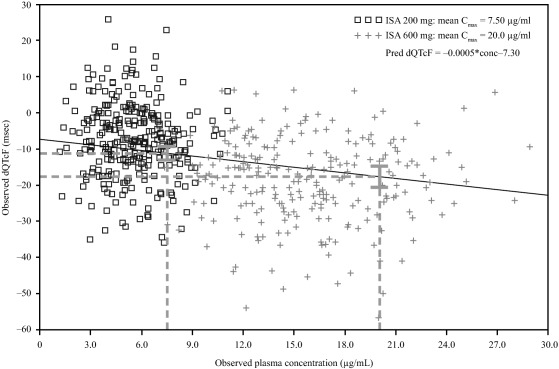
Figure 4.

Scatterplot of individual dQTcF vs. isavuconazole plasma concentration in the phase I clinical study. C max, maximum concentration; dQTcF, time‐matched, baseline‐adjusted QTcF interval; QTcF, Fridericia‐corrected QT interval. Postdose timepoints are shown at 200 mg (□) and at 600 mg isavuconazole (+). Dashed lines represent predicted dQTcF at the Cmax for 200‐mg and 600‐mg doses, shown with 90% CI.
