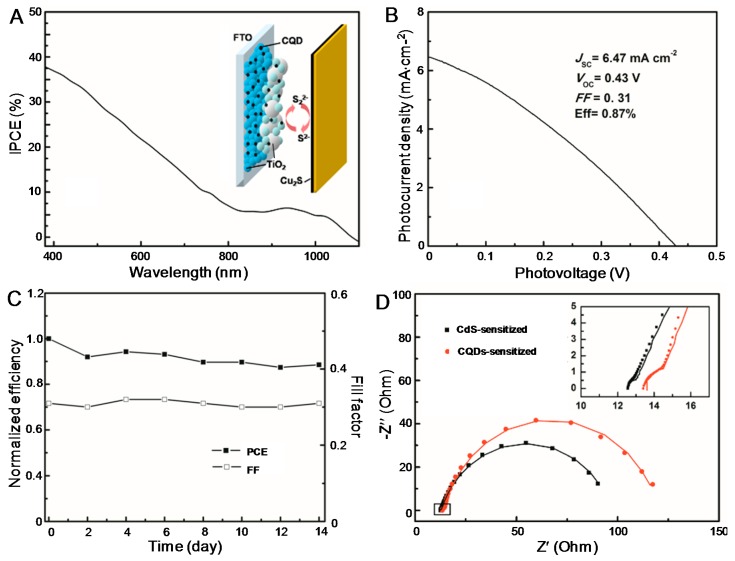
Figure 3.
(A) IPCE spectra and (B) JV curve of the CQDSC. Inset of (A) shows the structure of the solar cell. (C) Variation of the FF and PCE of the CQDSC as a function of storage time. (D) EIS results of the CdS-sensitized solar cell and CQDSC. The symbols are experimental results, while the solid lines are fitted curves based on the equivalent circuit developed previously [26].

