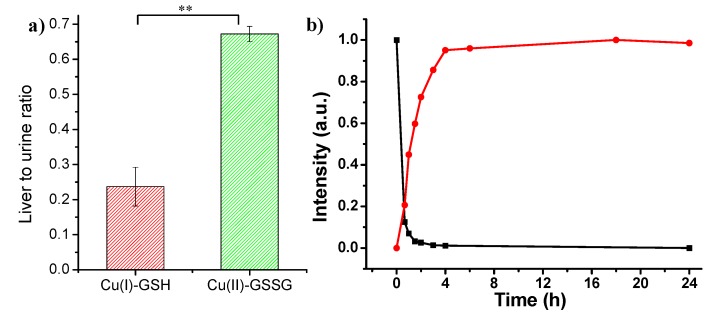
Figure 6.
(a) Liver-to-urine ratios of Cu(I)-GSH and Cu(II)-GSSG complexes at 24 h p.i.; (b) Time-dependent fluorescence intensity of Cu(I)-GSH complex (black curve) and absorption intensity (625 nm) of formed Cu(II)-GSSG complex from the oxidation of Cu(I)-GSH complex (red curve). (“**”, significance of difference).

