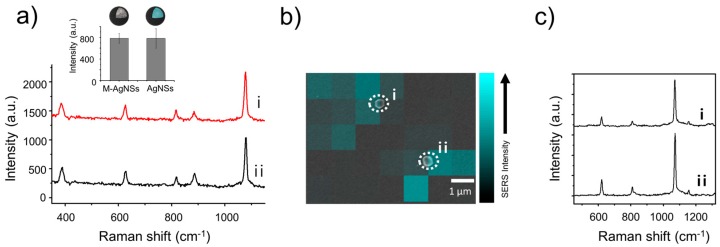
Figure 3.
(a) SERS spectra of 4-FBT on (i) M-AgNSs and (ii) AgNSs. The inset shows the intensities of the 1075 cm−1 peak of 4-FBT. The spectra were obtained using a portable Raman system with a 785 nm laser at a power of 30 mW for 1 s. (b) SERS intensity map of 4-FBT-treated M-AgNSs. The corresponding SEM image was overlaid with the SERS map. (c) SERS spectra obtained from single M-AgNS particles. Each spectrum (i,ii) corresponds to the single particles in SERS intensity map.

