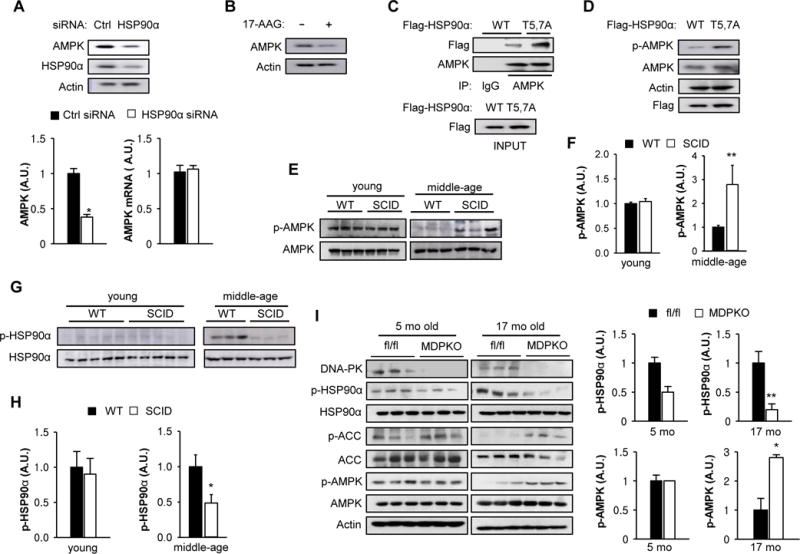
Figure 3. Inhibition of DNA-PK activates AMP-activated protein kinase.

(A) C2C12 myotubes were transfected with a siRNA for either control (Ctrl) or HSP90α and the expression level of HSP90α and AMPK were visualized by immunoblotting. Quantification is shown on the bottom left. All values are expressed as mean ± s.e.m. Mann-Whitney Test: *, p<0.05. (Bottom Right) C2C12 myotubes were transfected with a siRNA for either Ctrl or HSP90α and AMPKα mRNA was measured by using real-time PCR. All values are given as mean ± s.e.m. (B) C2C12 myotubes were treated with HSP90 inhibitor (1 μM 17-AAG) and the expression level of AMPK was visualized by immunoblotting. (C) C2C12 myotubes were transfected with vectors encoding Flag-tagged WT or T5,7A HSP90α. Interaction between mutant HSP90α and endogenous AMPK was visualized by immunoprecipitating with Flag antibody. (D) C2C12 myotubes were transfected with vectors encoding either WT or T5,7A HSP90α and the expression levels of Flag-tagged HSP90α and p-AMPK (T172) were visualized by immunoblotting. (E) AMPK phosphorylation (p-AMPK) in resting muscle isolated from young (3–4 months old) and middle aged (12–14 mo) WT and SCID mice. Three representative samples for each group are shown. (F) Quantification of p-AMPK in young (n=3 per genotype) and middle aged muscle (n=6 per genotype) from WT and SCID mice. Mann-Whitney Test: **, p<0.01. (G) HSP90α phosphorylation in resting skeletal muscle isolated from young and middle aged WT and SCID mice. (H) Quantification of p-HSP90α in young and middle aged muscle (n=7 per genotype). Mann-Whitney Test: *, p<0.05. (I) AMPK activation (p-AMPK, p-ACC1) and HSP90α phosphorylation in resting skeletal muscle isolated from young (5 months old) and old (17 months old) fl/fl and muscle specific DNA-PK knockout (MDPKO) mice. Quantification is shown on the right. Mann-Whitney Test: *, p<0.05: **, p<0.01.
