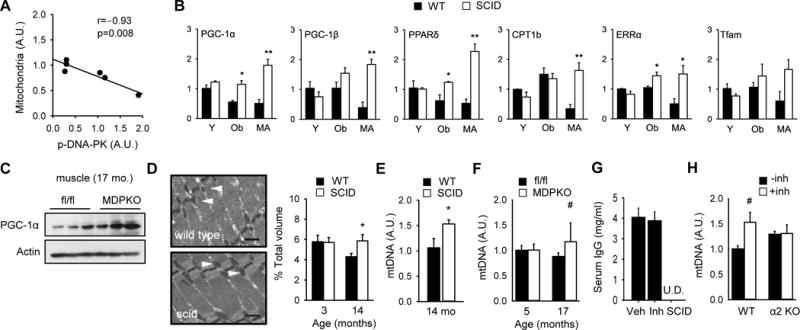
Figure 4. DNA-PK inhibition increases skeletal muscle mitochondrial biogenesis.

(A) Correlation between mitochondrial content and DNA-PKcs autophosphorylation in skeletal muscle of middle aged (14–16 yr) rhesus monkeys (r=−0.93, p=0.008). The correlation values were calculated by Pearson correlation. 95% confidence interval was −0.99 to −0.46. (B) Skeletal muscle was isolated from resting young (Y, 3–4 mo), obese (Ob, 5–6 mo) and middle aged (MA) WT and SCID mice. The mRNA levels (in arbitrary units) of genes important for mitochondrial biogenesis were measured by using real-time PCR (n=3–4 per group). All values are given as mean ± s.e.m. *, p<0.05, **, p<0.01 between WT and SCID values. (C) PGC-1α expression level in resting muscle isolated from old (17 months old) fl/fl and muscle specific DNA-PK knockout mice (MDPKO). (D) (Left) A representative electron micrograph of gastrocnemius isolated from middle aged WT and SCID mice (×10,000 magnification). Black bar indicates 500 nm. White arrowhead indicates mitochondria. (Right) Mitochondrial volume, expressed as percentage of total muscle volume, is shown for 3 mo and 14 mo WT and SCID mice. *, p<0.05 between WT and SCID values. (E) Relative mtDNA levels in skeletal muscle of middle aged WT and SCID mice (n=5–6 per genotype). *, p<0.05 between WT and SCID values. (F) Relative mtDNA levels in skeletal muscle of young (5 mo) and old (17 mo) fl/fl and MDPKO mice (n=5 per genotype). #, p=0.06. (G) Serum IgG levels of C57BL6/J mice treated with DNA-PK inhibitor for 10–12 week. Serum IgG was undetectable (U.D.) in SCID mice (n=5–13 per group). (H) Relative mtDNA levels in skeletal muscle of WT and AMPKα2 knockout mice fed either vehicle or DNA-PK inhibitor NU7441 (n=4–5 per genotype). #, p=0.06.
