
Figure 1.
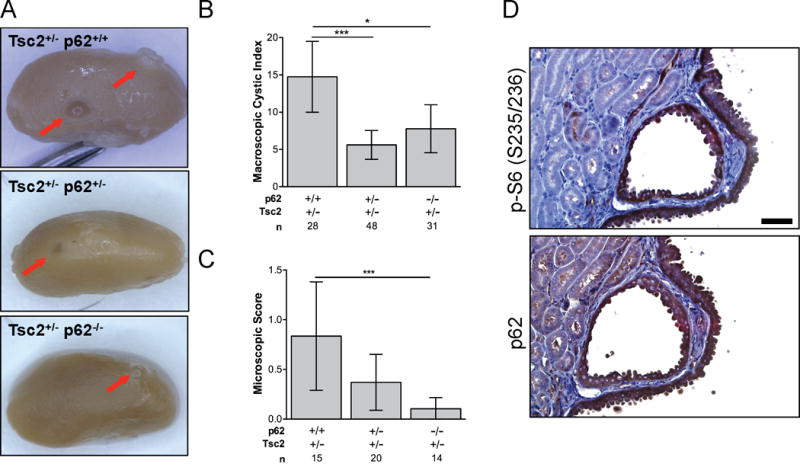
p62 promotes kidney tumorigenesis in Tsc2+/− mice. A, Representative kidneys of 10-month Tsc2+/− p62+/+, Tsc2+/− p62+/− and Tsc2+/− p62−/− littermates. Arrows indicate macroscopic cysts. B, The macroscopic cystic index was assessed for each kidney using an established method based on the number and size of the lesions. C, The microscopic score was determined by an established method for assessing cyst size and tumor filling from H&E sections. D, Phosphorylated S6 (S235/236) and p62 expression in cystadenoma lesions of Tsc2+/− mice. Scale bar, 50 μm. n is number of kidneys analyzed. Data presented as mean +/− 95% CI with *p<0.05, ***p<0.001.