
Figure 2.
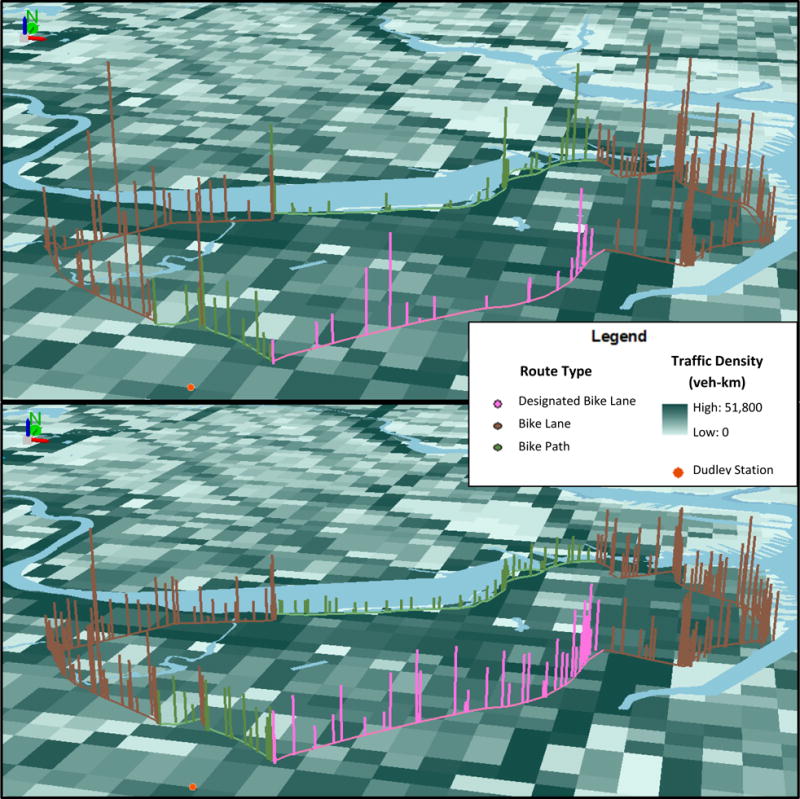
Map of BC (top) and NO2 (bottom) concentrations on Route 4, divided into the three bike route types. Average daily vehicle kilometers per 200 m square grids are shown in blue. These are 3D representations; comparisons of linear distance and magnitude of pollutant can only be made with nearby points.